以有机半导体为代表的有机多功能材料的物理/化学结构和形貌本质上决定了其电学和光学性能。液晶态(liquid crystal, LC)分子自组装(self-assembly) 和自取向 (self-alignment)机理对实现有机半导体物理形貌的有效调控提供了新的机遇;进而期待可以被利用去有效地控制其光电性能的异向性(例如电致发光,荧光反应,电子和空穴传导)和产生全新的制造先进功能光电结构的加工技术。然而,不同于常规使用的低分子模量液晶材料,液晶有机共轭高分子 (conjugated polymers)半导体的相变温度会非常高(通常高于200摄氏度)。在这种高温下,工业界和实验室常用的Rubbed Polyimide取向薄膜会出现结构不稳定,进而失效。另外,现阶段可以有效地对共轭高分子半导体材料做高精度取向排列控制的技术也缺失,这对于有机发光二极管 (OLEDs),激光 (Organic Semiconductor Lasers),太阳能电板 (Organic Solar Cells)和场效应管 (Field-Effect Transistors)的制造和性能提高是非常不利的。
为了解决上述难题,本文首次采用双光子激光直写技术,并结合具有高温稳定性的光控取向材料(SD1)和偏正紫外光照射,成功实现了对于光控取向纳米薄膜取向排列的亚微米精度控制。然后通过在激光直写完毕后的光控取向薄膜上旋涂荧光液晶有机共轭聚合物薄膜,跟进在惰性气氛里进行优化后的热处理工艺(具体加工工艺参考图一),实现了空间取向排列图形从光控取向薄膜到荧光液晶有机共轭聚合物薄膜的有效转移。通过系统的优化激光能量密度和直写速度,本文报道了在荧光液晶有机共轭F8BT薄膜里≈750 nm的二维控制精度。基于Micro-PL spectra和polarised confocal fluorescence imaging结果,在光致聚合链取向的F8BT薄膜里观察到了全新的,可以利用不同偏正方向分离的两个不同的发光激发态(emissive intra/interchain species),并归因与紫外光激发和双光子吸收产生的迥异的分子取向结构。
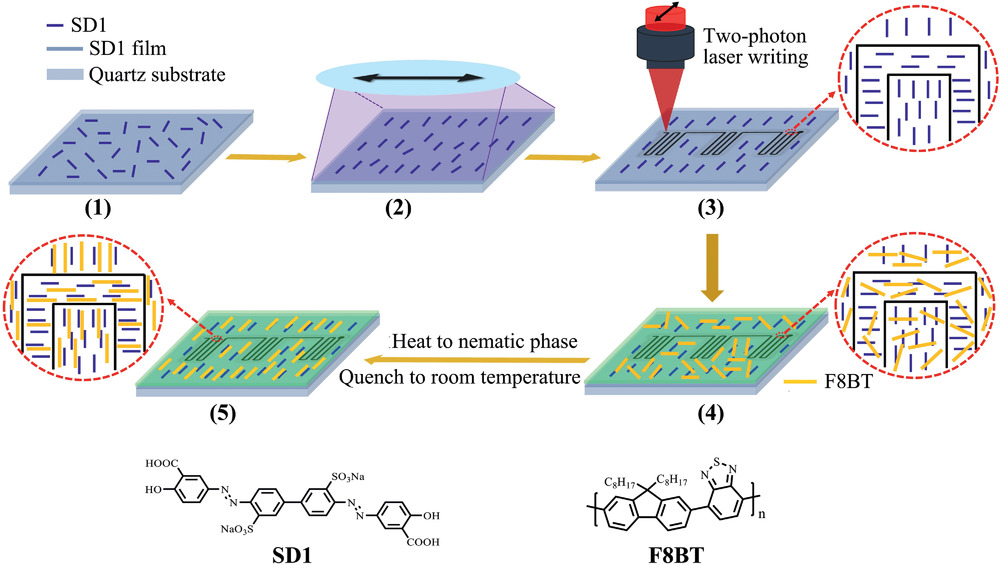
图一. (1) SD1 photoalignment layer is spin‐coated and (2) aligned initially through uniform exposure to linearly polarized UV illumination. (3) Regions of the photoalignment layer are then realigned using two‐photon laser writing. The SD1 molecules orient perpendicular to the polarization of the incident light; here the reorientation is shown to be orthogonal to that of the UV‐aligned background but it is possible to tune the relative angle by adjusting the laser beam polarization direction. An F8BT film is then spin‐coated onto the SD1 layer (4) and heated to isotropic melt before slow cooling into the nematic LC phase, where the polymer chains become oriented along a direction defined by the SD1 molecular orientation. The polymer chain and associated optical transition dipole moment orientations are then frozen‐in by rapid quenching to room temperature (5) to form a nematic glass film.
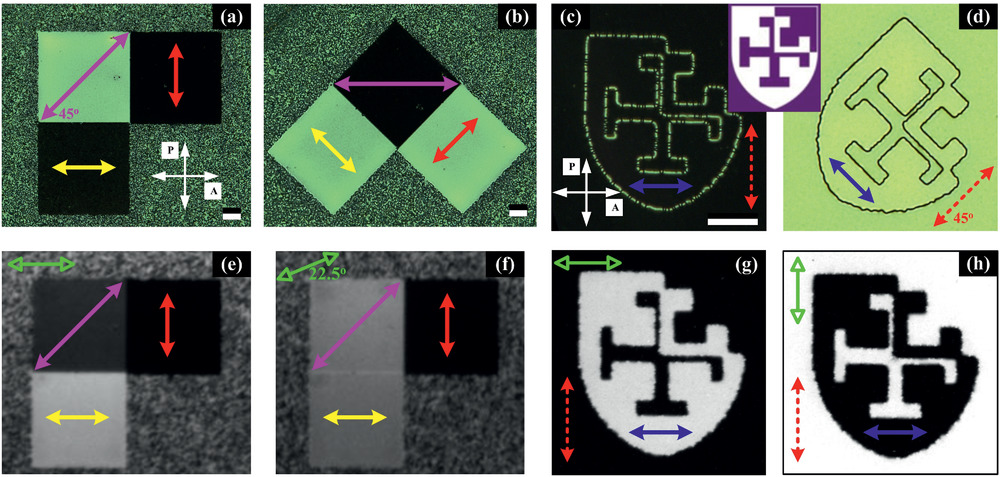
图二.(a - d) Polarized optical micrographs and (e – h) polarized fluorescence intensity images demonstrating laser patterned orientation in quenched nematic glass F8BT films. The micrographs are recorded with the samples placed between the crossed polarizer and analyzer pairs; double‐headed white arrows in (a) and (c) delineate the polarization directions, labeled, respectively, P and A. The square patterns ((a) and (b)) were two‐photon laser written with a bi‐directional raster on a non‐aligned SD1 layer using different optical polarizations and the F8BT films were then spin‐coated on top before thermotropic alignment and quenching. The resulting F8BT chain axis orientation directions are indicated by double‐headed yellow, red, and pink arrows for the three separate squares. The crest pattern ((c) and (d)) based on the St. Cross College Oxford crest (see inset) was laser rewritten on a UV‐aligned SD1 film with a polarization direction at 90° relative to the UV‐oriented background. The double headed blue and dashed red arrows show, respectively, the orientation of the polymer chains in the crest and the background. A dark state is observed when the orientation of the polymer chains is parallel to either the polarizer or analyzer whereas a bright state is observed when it is at 45° to the axes of the polarizer/analyzer. For the crest, the visibility of the pattern only arises because of a transition region between the two orthogonal orientations which shows up bright for (c) and dark for (d), consistent with a local orientation that is intermediate between the two main orientations. Polarized PL intensity images are shown for the squares in (e) and (f) and the crest pattern in (g) and (h). The doubled headed green arrows show the orientation of the analyzer used to select the polarization of the collected emission light. There is a clear correlation between the polarized PL intensity and the designed polymer chain alignment. The scale bars in all images are 20 μm.
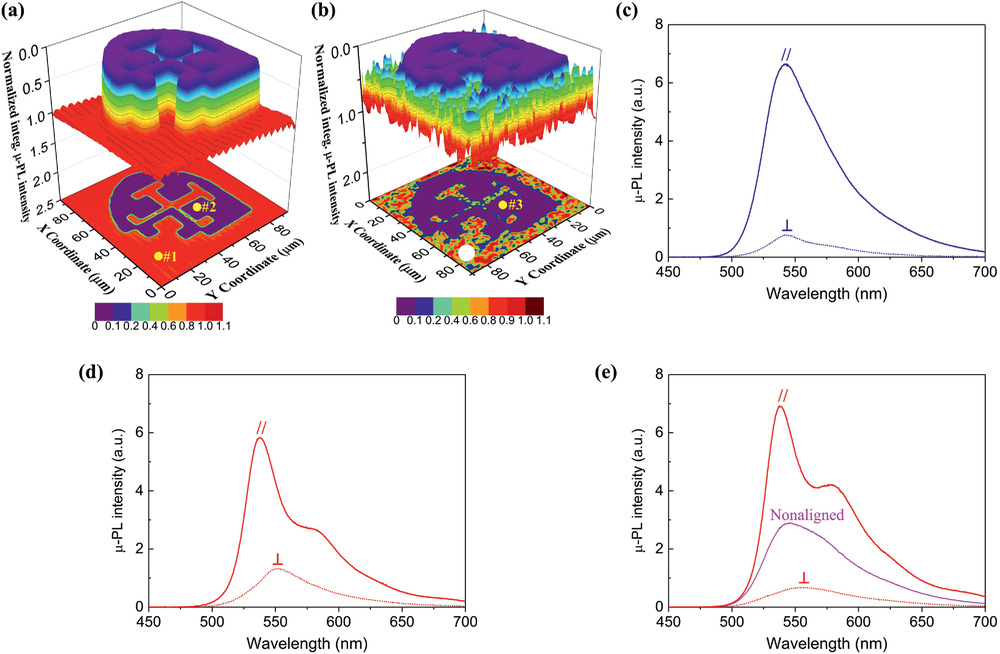
图三.Spectrally integrated Micro‐PL intensity maps and selected spectra for different locations on F8BT films with laser (re)written SD1 alignment patterns. Intensity maps, which have been normalized to the maximum emission intensity in each case, are shown where the background was (a) aligned with UV illumination and (b) nonaligned. For (a), the excitation polarization and the PL collection polarization were aligned along the x‐axis, which is orthogonal to the orientation of the F8BT polymer chains in the laser written crest and parallel to the UV‐aligned background. For (b), the excitation was along the y‐axis (chain alignment direction in the crest) and the PL collection polarization was along the x‐axis. PL spectra are shown for: (c) location #1 in (a); (d) location #2 in (a); and (e) location #3 in (b) along with the spectrum from a nonaligned F8BT region highlighted by the white dot (bottom corner in the 2‐D intensity map of (b)). For each location, the excitation polarization was rotated to lie along the local chain orientation direction and PL spectra were collected with the analyzer both parallel and perpendicular to this direction. For the nonaligned spectrum, the excitation was along the y‐axis and the analyzer polarization was along the x‐axis.

图四.F8BT laser‐pattern resolution optimization. (a) Crossed‐polarizer optical microscope images for F8BT oriented on groups of four laser rewritten SD1 lines at 5 μm separation intervals on a UV‐aligned uniform SD1 background. Double‐headed white arrows represent the polarization directions for the incident light polarizer, P, and the transmitted light analyzer, A. The top two panes (each with dark and bright states for the background) were rewritten using the 0.5 NA and the bottom two the 0.95 NA objective lens. The writing (substrate displacement) speed used for each set of lines is shown as a graded scale at the bottom of the sub‐figure. Results are presented for polarizations of the rewriting laser that are either at 90° (solid double‐headed blue arrow; 1st and 3rd panes) or 45° (dashed double‐headed blue arrow; 2nd and 4th panes) relative to the uniform UV‐aligned background (dashed double‐headed red arrows). These images were used to extract the FWHM linewidth of the patterned F8BT orientation stripes. (b) The FWHM is plotted as a function of laser writing speed and (c) laser power, parametric in each case in the objective lens numerical aperture (NA = 0.5, red squares; 0.95, blue circles) and laser polarization relative to the background uniform UV‐alignment polarization (90° writing, filled symbols; 45° writing, open symbols). The horizontal dash‐dotted line in (b) delineates a 1 μm FWHM.
相关研究成果以“Two-photon Laser-written Photoalignment Layers for Patterning Liquid Crystalline Conjugated Polymer Orientation”为题发表在材料学顶刊Advanced Functional Materials上。牛津大学史玉平博士为论文第一作者兼通讯作者,Patrick Salter研究员,Steve Morris和Donal Bradley (FRS)教授为本文的共同通讯作者。
论文信息:Yuping Shi*, Patrick S. Salter*, Mo Li, Robert A. Taylor, Steve J. Elston, Stephen M. Morris*, Donal D.C. Bradley*, Two-photon Laser-written Photoalignment Layers for Patterning Liquid Crystalline Conjugated Polymer Orientation, Advanced Functional Materials 2020, DOI: 10.1002/adfm.202007493.
原文链接:https://onlinelibrary.wiley.com/doi/10.1002/adfm.202007493
- 天科大赵倩-李盛华课题组:基于原位聚合酒石酸的室温激光复写磷光材料 2024-09-05
- 中山大学周建华/乔彦聪、清华大学任天令InfoMat:具有高拉伸性和稳定性的微米织物增强应变传感器用于全范围和周期性人体运动监测 2024-03-07
- 华南理工大学王小慧、王蕾团队 Chem. Eng. J.:激光直写复合蜂窝纸基多功能传感平台 2023-12-30
- 苏州大学张正彪/沈行团队 JACS:柔性活化策略用于机械力化学合成共轭聚合物并同步释放荧光小分子 2026-05-11
- 武大李振教授/天大武文博教授/南方医大胡方教授 Adv. Mater.:用于光诊疗的无均聚偶联缺陷的共轭聚合物 2026-05-08
- 北大雷霆-张志团队 AFM 综述:生物相容性共轭聚合物 2026-02-28
